

11 District Tournaments
Teams advance through the season depending on the events at which they compete: Regional or District. This section details how District teams advance from District qualifying events to their District Championship.
11.1 District Events
District teams are ranked throughout the season based on the points they earn at the first 2 home District events they attend, as well as at their District Championship. Points are awarded to teams as follows:
| Category | Points |
|---|---|
| Qualification Round Performance | Normal distribution of points from 22 to 4 across the highest ranked team to the lowest based on an equation. See section 11.1.1 Qualification Round Performance for details. For a typically sized District event, this will result in a minimum of 4 points being awarded for Qualification round performance. For events of all sizes, a maximum of 22 points will be awarded. |
ALLIANCE | Equal to 17 minus the ALLIANCE ALLIANCE |
| Draft Order Acceptance | Equal to 17 minus the Draft Order Acceptance Number (e.g. 12 points for the team that accepts the fifth draft position, regardless of whether it was delayed per T605.) |
| Playoff Advancement | Points awarded based on team participation in individual playoff rounds, and whether or not the ALLIANCE |
| Team Judged Awards | 10 points for FIRST Impact Award 8 points each for Engineering Inspiration and Rookie All Star Awards 5 points each for all other team judged awards |
| Team Age | 10 points for 2026 rookie teams 5 points for 2025 rookie teams |
Points earned at District Championships are multiplied by 3 and then added to points earned at District events, to determine the final season point total for the team.
If there is a tie in the season point total between teams, the higher ranked team will be determined using the following additional sorting criteria:
| Order Sort | Criteria |
|---|---|
| 1st | Total Playoff Performance Points |
| 2nd | Best Playoff Points at a single event |
| 3rd | Total ALLIANCE |
| 4th | Highest Qualification Round Seed or Draft Order Acceptance (i.e. Highest ALLIANCE |
| 5th | Total Qualification Round Performance Points |
| 6th | Highest Individual MATCH MATCH |
| 7th | Second highest Individual MATCH MATCH |
| 8th | Third highest Individual MATCH MATCH |
| 9th | Random Selection |
11.1.1 Qualification Round Performance
The calculation of Qualification performance points is done using the equation below. This equation is an inverse error function which utilizes the following variables:
- – the qualification rank of the team at the event at the conclusion of QualificationR(as reported byMATCHES)FMS
- N – the number of FIRST Robotics Competition teams participating in the Qualification rounds at the event
- Alpha (α) – a static value (1.07) used to standardize the distribution of points at events

This formula generates an approximately normal distribution of Qualification Round Performance points at an event, based on rank, with most teams getting a moderate number of points, and fewer teams getting the highest or lowest numbers of points available.
Table 11‑3 displays sample Qualification Round Performance points for variously ranked teams at a 40-team event. The system will automatically generate the appropriate points for each team based on their rank and the number of teams at the event.
| Rank | 1 | 2 | 3 | 4 | … | 19 | 20 | 21 | … | 37 | 38 | 39 | 40 |
|---|---|---|---|---|---|---|---|---|---|---|---|---|---|
| Points | 22 | 21 | 20 | 19 | … | 13 | 13 | 12 | … | 6 | 6 | 5 | 4 |
11.1.2 ALLIANCE Selection Results
This attribute measures both individual team qualification round seeding performance and recognition by peers.
Note also that
11.1.3 Playoff Performance
This attribute measures team performance as part of an
Teams that advance to at least
![]()
ALLIANCE | β |
|---|---|
| 1st Place (Winners) | 20 |
| 2nd Place (Finalists) | 20 |
| 3rd Place (loser of MATCH | 13 |
| 4th Place (loser of MATCH | 7 |
In most cases, unless a BACKUP is recruited, a team plays 100% of the DE
Teams on the winning
For example, if Team X’s
The maximum number of Playoff Performance Points a team can earn is 30 (20 DE points + 10 Finals Points).
11.1.4 Team Judged Awards
This attribute measures team performance with respect to team awards judged at the event.
The points earned for team awards in this system are not intended to capture the full value of the award to the team winning the award, or to represent the full value of the award to FIRST. In many ways, the team’s experience in being selected for awards, especially the FIRST Impact Award, the Engineering Inspiration Award, and the Rookie All Star Award (which is optional for District Championship events), is beyond measure, and could not be fully captured in its entirety by any points-based system. Points are being assigned to awards in this system only to help teams recognize that FIRST continues to be “More than
Teams only receive points for team awards judged at the event. If an award is not judged, is not for a team (e.g. the Dean’s List Award) or is not judged at the event (e.g. Safety Animation Award, sponsored by UL), no points are earned.
11.1.5 Team Age
This attribute recognizes the difficulty in being a rookie or relatively new team.
Points are awarded to 2025 and 2026 rookie teams in recognition of the unique challenges teams face in those early years, and to increase the chance that they will make it to the District Championship to compete with their
11.1.6 Regional Participation
District teams neither earn points for their actions at any Regionals, nor are eligible for any FIRST Championship qualifying benefits at that Regional (awards, etc.).
11.2 District Championship Eligibility
A team competing in a District qualifies for their District Championship by meeting 1 of the following criteria:
- A. District FIRST Impact Award Winner,
- B. District Ranking (based on total points earned at their first 2 home District events as detailed in section 11.1 District Events),
Teams do not earn points at third or subsequent District events, nor at any inter-district or Regional events at which they compete during the season.
If a team declines an invitation to the District Championship, the next highest uninvited team on the list is invited, and so on, until the event capacity is filled.
- C. District Engineering Inspiration winner (qualifies to compete for the award only), and
- D. District Rookie All Star winner (qualifies to compete for the award only).
The capacity of each District Championship is shown in Table 11‑5. Each District determines the number of teams that qualify for their District Championship. These limits are based on factors including but not limited to the total number of teams in the District, available venue capacity, etc.
| District Championship | Capacity | Divisions |
|---|---|---|
| FIRST California – Northern California* | 60 | 1 |
| FIRST California – Southern California* | 60 | 1 |
| FIRST Chesapeake District Championship | 54 | 1 |
| FIRST in Michigan State Championship | 160 | 4 |
| FIRST in Texas District Championship | 90 | 2 |
| FIRST Indiana State Championship | 38 | 1 |
| FIRST Israel District Championship | 42 | 1 |
| FIRST Mid-Atlantic District Championship | 66 | 1 |
| FIRST North Carolina State Championship | 50 | 1 |
| FIRST Ontario Provincial Championship | 100 | 2 |
| FIRST South Carolina State Championship | 32 | 1 |
| FIRST Wisconsin District Championship | 36 | 1 |
| New England District Championship | 100 | 2 |
| Pacific Northwest District Championship | 50 | 1 |
| Peachtree District State Championship | 45 | 1 |
- Due to the strong geographic concentration of teams in two main regions of California, there are two separate District Championships, but California will remain as one district. Teams in California can compete and earn points in any District Qualifier event in California. Teams are ranked based on the region they are located in (Northern or Southern California) and advance to one of two District Championships. The top 60 teams in each area (North and South) advance to their District Championship.
11.3 District Championships with Multiple Divisions
If a District Championship has too many teams to allow all teams 12 Qualification
The process employs a “brute force iterative randomizer” and is executed as follows:
- The district team list is sorted in order of cumulative district points earned as described in section 11.1 District Events.
- The list is divided into quartiles based on rank (e.g. the first quartile has the top 25% ranked teams). If the total number of teams is not evenly divisible by 4 times the number of divisions, additional teams are distributed to quartiles 4, then 2, then 3.
- Division assignments are randomly generated using equal contributions from each quartile.
- 3 criteria are calculated for each division:
- a. average strength: the arithmetic mean of the district point values of teams in a division
- b. distribution of strength: the Signal to Noise Ratio (SNR) of the district point values of teams in a division. SNR is calculated as follows:
![]()
![]()
σ = standard deviation of the district points in a division
- c. distribution of strength for “top” teams: The SNR of the district point values of teams in the first quartile of a division
- The 3 criteria for each division are compared to the other division(s). If the difference between the division’s value and any other division’s value exceeds the limits in Table 11‑6, the criteria is not met.
| 2 divisions | 4 divisions | |
|---|---|---|
| Average strength | 1 | 2 |
| Distribution of strength | 1 | 2.5 |
| Distribution of strength for “top” teams | 1.5 | 2 |
- If all 3 criteria met, event organizers publish the assignments. If any of the 3 criteria are not met, assignments are rejected, and the process returns to Step 3.
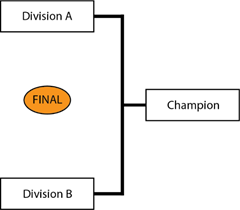
11.4 District Championship Playoffs
In these cases:
- Division winning play each other in District Championship Playoffs, employing the brackets shown in Figure 11‑1 and Figure 11‑2 (and detailed in Table 11‑7) that corresponds to their District, until a winningALLIANCESfor the event is determined.ALLIANCE

| Round | MATCH | Upper/ Lower | Gap (min) | Gap (min) | Next MATCH MATCH ALLIANCE | Next MATCH MATCH ALLIANCE | ||
|---|---|---|---|---|---|---|---|---|
| Round | MATCH | Upper/ Lower | Blue | Red | Blue | Red | Winner | Loser |
| 1 | 1 | Upper | B | A | M3 ( R | M4 ( R | ||
| 1 | 2 | Upper | D | C | M3 (B) | M4 (B) | ||
| 15-minute break | 15-minute break | 15-minute break | 15-minute break | 15-minute break | 15-minute break | 15-minute break | 15-minute break | 15-minute break |
| 2 | 3 | Upper | W2 | W1 | 17m | 24m | M6 ( R | M5 ( R |
| 2 | 4 | Lower | L2 | L1 | 24m | 31m | M5 (B) | |
| 15-minute break | 15-minute break | 15-minute break | 15-minute break | 15-minute break | 15-minute break | 15-minute break | 15-minute break | 15-minute break |
| 3 | 5 | Lower | W4 | L3 | 17m | 24m | M6 (B) | |
| 15-minute break | 15-minute break | 15-minute break | 15-minute break | 15-minute break | 15-minute break | 15-minute break | 15-minute break | 15-minute break |
| Finals | 6 | W5 | W3 | 17m | 44m | M7 | M7 | |
| 15-minute break | 15-minute break | 15-minute break | 15-minute break | 15-minute break | 15-minute break | 15-minute break | 15-minute break | 15-minute break |
| Finals | 7 | W5 | W3 | 17m | 17m | M8* | M8* | |
| 15-minute break | 15-minute break | 15-minute break | 15-minute break | 15-minute break | 15-minute break | 15-minute break | 15-minute break | 15-minute break |
| Finals | 8* | W5 | W3 | 17m | 17m |
- if required
- Each team on a Champion of a 2-Division District Championship Playoff tournament earns 10 points.ALLIANCE
- For a 4-Division District Championship Playoff tournament, each team on a Champion earns 20 points and each team on a FinalistALLIANCEreceives 10 points.ALLIANCE
- If any of these has recruited a BACKUP TEAM, these points are divided amongst the teams as described in section 11.1.3 Playoff Performance.ALLIANCES
- If an in a District Championship Playoff has not yet recruited a BACKUP TEAM per section 10.6.3 BACKUP TEAMS, theALLIANCECAPTAIN may bring in only the highest ranked team from their division’s BACKUP POOL to join itsALLIANCE.ALLIANCE
- Each team on a Champion
11.5 FIRST Championship Eligibility
Each District determines the number of Dean’s List Finalists, FIRST Impact Awards, Rookie All Star Awards, and Engineering Inspiration Awards to present at their District Championship, within a range established by FIRST. The team counts are based on the team representation of the respective District at the Championship. For the awards, ranges are developed by using ratios agreed upon by FIRST and District Leadership. These ranges allow each District to represent their own community as they see fit.
- For the FIRST Impact Award, the ratios range from one FIRST Impact Award team for every 18 Championship District teams to one FIRST Impact Award team for every nine Championship District teams.
- For the Dean’s List Finalist Award, the ratios range from one Dean’s List Finalist for every nine Championship District teams to one Dean’s List Finalist for every six Championship District teams.
- All Districts, regardless of FIRST Championship Slot allocation, may award one or two Engineering Inspiration and Rookie All-Star Awards.
The following teams competing in the District model earn a Merit-Based Qualifying slot:
- District Championship
- o FIRST Impact Award Winners
- o Engineering Inspiration Award Winners
- o Rookie All-Star Winners (the judges can decide if they present this award or not)
- o Winning membersAlliance
- as many teams in District-points total order to fill the Allocated FIRST Championship slots granted per the table below.
Districts receive the percentage of 'available slots' at FIRST Championship, rounded up to the nearest whole slot, equal to the percentage of teams they have in their District compared to the total of all FIRST Robotics Competition teams. 'Available slots' are calculated by taking the total number of slots at FIRST Championship and subtracting the number of pre-qualified teams. This overall calculation uses a ‘snapshot’ of teams that have registered and paid as of three weeks after initial season payment was due.
| District | Allocated FIRST Championship Slots | FIRST Impact Award Winners | Dean's List Award Finalists | Engineering Inspiration Award Winners | Rookie All-Star Award Winners | Woodie Flowers Award Finalists |
|---|---|---|---|---|---|---|
| FIRST California | 46* | 2 per DCMP | 4 per DCMP | 1 per DCMP | 1 per DCMP | 1 per DCMP |
| FIRST Chesapeake | 19 | 2 | 3 | 1 | 1 | 2 |
| FIRST in Michigan | 83 | 5 | 14 | 1 | 2 | 3 |
| FIRST in Texas | 28 | 2 | 5 | 2 | 2 | 2 |
| FIRST Indiana Robotics | 12 | 1 | 2 | 2 | 0 | 1 |
| FIRST Israel | 12 | 1 | 2 | 1 | 1 | 1 |
| FIRST Mid-Atlantic | 23 | 2 | 4 | 2 | 1 | 2 |
| FIRST North Carolina | 15 | 1 | 3 | 2 | 2 | 1 |
| FIRST South Carolina | 7 | 1 | 2 | 1 | 1 | 1 |
| FIRST Wisconsin | 12 | 1 | 2 | 1 | 1 | 1 |
| NE FIRST | 32 | 4 | 6 | 2 | 1 | 2 |
| Ontario | 21 | 2 | 3 | 1 | 1 | 2 |
| Pacific Northwest | 21 | 2 | 4 | 2 | 1 | 2 |
| Peachtree | 13 | 2 | 2 | 2 | 1 | 1 |
- Due to the strong geographic concentration of teams in two main regions of California, there are two separate District Championships, but California will remain as one district. Teams in California can compete and earn points in any District Qualifier event in California. Teams are ranked based on the region they are located in (Northern or Southern California) and advance to one of two District Championships. The top 46 teams from the entire District advance to FIRST Championship.
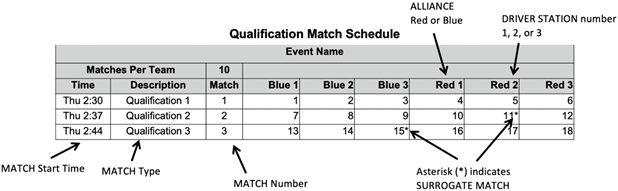
10 Tournaments (T)
Each 2026 FIRST Robotics Competition event is played in a tournament format. Each tournament consists of 3 types of MATCHES: Practice MATCHES (not necessarily played at all District Events), Qualification MATCHES, and Playoff MATCHES.
12 Regional Tournaments
Teams advance through the season depending on the events at which they compete: Regional or District. This section details how Regional teams advance from Regional events to FIRST Championship.